This site uses cookies to improve your experience. To help us insure we adhere to various privacy regulations, please select your country/region of residence. If you do not select a country, we will assume you are from the United States. Select your Cookie Settings or view our Privacy Policy and Terms of Use.
Cookie Settings
Cookies and similar technologies are used on this website for proper function of the website, for tracking performance analytics and for marketing purposes. We and some of our third-party providers may use cookie data for various purposes. Please review the cookie settings below and choose your preference.
Used for the proper function of the website
Used for monitoring website traffic and interactions
Cookie Settings
Cookies and similar technologies are used on this website for proper function of the website, for tracking performance analytics and for marketing purposes. We and some of our third-party providers may use cookie data for various purposes. Please review the cookie settings below and choose your preference.
Strictly Necessary: Used for the proper function of the website
Performance/Analytics: Used for monitoring website traffic and interactions
Having a set of metrics that you watch & that you feel are the key drivers of your success helps keep clarity. And the more public you can make your goals for these key metrics the better. You will likely have multiple sets of metrics you keep depending on the company’s stage, one’s function in the company and level.
FBe's recommendation was (paraphrasing a 35 min talk): Don't invent new metrics, use online versions of Reach and GRPs to measure success. Because we don't understand the uniqueness, we fall back on profoundly sub-optimal old world metrics like Reach or Online GRP equivalents. Metrics are a problem. Let's go!
There are more mistruths and F U D about Web analytics out there than I think is reasonable. Web Analytics, this beautiful child, was born just the other day in the midst of tumultuous times, quite literally, when everything changes every day. Here are ten web analytics ground truths… 1. Part of it fueled by Vendors.
Instead, we’re comparing Mixpanel and Google Analytics in the terms that drive business growth—identifying the core use cases for each tool and the business problems they solve, while highlighting the features that make it possible. That’s as useful as analytics without analysts: troves of data but no actionable insights. Acquisition.
You must use metrics that are unique to the medium. Ready for the best email marketing campaign metrics? So for our email campaign analysis let’s look at metrics using that framework. Optimal Acquisition Email Metrics. Most good email providers will do this automatically for whatever web analytics tool you use.
There is no golden metric for everyone, we are all unique snowflakes! :). and tell you what are the best key performance indicators (metrics) for them. In the past I’ve shared a cluster of metrics that small, medium and large businesses can use as a springboard…. If you want to play along. Don’t read what I’ve chosen.
If you’re not tracking form analytics, you don’t know. Form analytics can illuminate potential issues. Form analytics provide quantitative data on metrics such as field timings, field re-entries, last field before abandonment, completion rates by segment, etc. Form analytics and conversion optimization.
about digital marketing and analytics. We will cover questions in four areas: business/strategy challenges, analytics/technical challenges, career/self-development questions and rampant speculation. Even the worst analytics configuration in the world will most likely allow you to measure cart and checkout abandonment rate.
In this blog post I want to share four analytics tools that I have been playing with for a while… tools that solve an interesting problem… tools that point to what might be in terms of our near term analytical future… and in almost all cases they don't even know! First Some Context. Say it ain't so! :).
The last blog post shared custom analytics reports that you can use to find amazing insights faster, enabling you to create a focused, truly data driven organization. I am an unabashed segmentation fan: Web Analytics Segmentation: Do Or Die! Web Analytics or WebTrends or. three awesome analytics data segments. #1:
One of the most significant changes in how we do product today is our use of analytics. Any capable product leader today is expected to be comfortable with data, and understand how to leverage analytics to learn and improve quickly. When most people think of analytics they think of web analytics. That is but one type.
Over 13 years ago, in March of 2000, I wrote a blog post titled “ The Most Powerful Internet Metric of All. ” The key thesis was this: if an Internet company could obsess about only one metric, it should be conversion. As such, it is time to pound the table again – conversion is by far the most powerful Internet metric of all.
Nose to the grind "How do I" questions: David Walizer: How do you sell the value of web analytics to a skeptical client in 30 seconds or less? By doing multichannel analytics! More detail on those techniques, and three more, are in this blog post: Multichannel Analytics: Tracking Offline Conversions. Let's go!
There are few things more complicated in analytics (all analytics, big data and huge data!) I normally ask people to look at the Path Length report in the Multi-Channel Funnels standard report in Google Analytics (or equivalent tool if you are using SiteCatalyst or WebTrends or other web analytics tools). It is sweet.
The ability to slice and dice your Google Analytics data is the difference between mediocre, surface-level insights and meaningful, useful analysis. In this article we’ll show you how to setup your Google Analytics to unlock actionable insights. Setting up your Google Analytics. You can read a more in-depth guide here.).
Following revelations of NSA activities via Mr. Snowden, Google has now switched almost all users to secure search, resulting in even more user search queries showing up as not provided in all web analytics tools. No keyword data in analytics tools. Aggregated search engine level analysis. Implications of Secure Search Decision.
Would you believe me when I say that your digital analytics data, from Google Analytics or WebTrends et. We do have A LOT of data in our analytics tools. But sometimes going outside our analytics tools can yield non-normal insights that can deliver a competitive advantage. Neither is an example of just site analytics.
In liquid markets, most of the calories expended on technology and analytics are focused on trade selection, or “ origination ”. I walk through below how progressive investors are using technology and analytics throughout all of their operations. The 11 Steps of Investing in Private Companies. 1) Manage the firm . 3) Raise capital.
Here are just a few things you can do by leveraging data analytics: Gain a better understanding of changing customer preferences Discover new business opportunities Identify and eliminate bottlenecks in your operations Minimize and better allocate advertising costs Provide greater customer support through automated chat. Invest in analytics.
The best video hosting platform varies business by business, depending on factors like: How often you’re uploading; How you plan to use the video; The viewing experience you want to give your audience; The analytics you need; The cash you have to spend. Wistia’s analytics can help connect the dots between video consumption and conversions.
So, we decided to aggregate NextView’s “greatest hits.” Advice on How to Make Your First Analytics Hire “Analytics is about designing, reporting, and leveraging operating metrics to aid strategic and functional decision-making. What Are Your Valuation Expectations? Hiring Your Team.
This typically involves a CRM system or tool that helps automate and aggregate various customer touchpoints. It automates simple tasks, sets reminders and checkpoints, and even allows you to integrate directly with other analytics platforms. Analytics and optimization. How to choose a CRM for your business.
The outcome of book smart is rarely better for analytics practitioners then folks trying to learn how to fly an airplane from how-to books. This is all the way from Aug 2009: Web Analytics Career Advice: Play In The Real World! And, happily, it has almost all of the Google Analytics features implemented correctly.
The ability to slice and dice your Google Analytics data is the difference between mediocre, surface-level insights and meaningful, useful analysis. As Avinash Kaushik famously wrote, “All data in aggregate is crap.” Setting Up Your Google Analytics. ” [Tweet It!]. You can read a more in-depth guide here.).
The world of digital analytics seems to be insanely complicated. I led a discussion the other day with a collection of people who were brand new to the space and some who were jaded long-term residents of Camp Web Analytics. Digital Analytics Ecosystem: The Inputs. Digital Analytics Ecosystem: The Outputs. Averages this.
The more well-known your company becomes, the harder it gets to directly impact primary KPI’s at the aggregate level because the majority of customers who buy are going to do so irrespective of if your button color is red or blue. For example, Adobe Analytics (Omniture) only allows the use of historical data for personalization.
That’s why you need to be simultaneously feeding your growth engine , while monitoring churn and your other startup metrics. They refer to these differences as “ Red Flag” Metrics (or RFMs). Total number of logins also proved to be an important metric, though not as much so as the former two. times per day on average.
How do you coordinate the analytics setup of a web shop that sells their products all over the world—if you have to handle 10+ languages and currencies in over 80 countries? Aggregate them and consider how those needs transfer to your web analysis tool: What do you want to analyze? Can all data be stored within Google Analytics? .
There are NO analytical models can truly explain WHY things happen. There is another method of text analytics called sentiment analysis or, sometimes, opinion mining. Text analytics uses an algorithm to convert text to numbers to perform a quantitative analysis. No single metric, NPS included, is perfect. — ?? ??
But the problem is that single golden metrics hide valuable insights and, more often than not, drive bad behavior. Here's my proposal: If you are pushed to have a single golden metric, give it a partner. The BFF metric you find should not be one that is very far away. So, great metric. Honestly, who can blame them.
. "What is the difference between a metric and a key performance indicator (KPI)?" " "What is a dimension in analytics?" " "Are goals metrics?" There seems to be genuine confusion about the simplest, most foundational, parts of web metrics / analytics. " And many more.
We’ve had clients report SEO metrics from Adobe Analytics, while PPC metrics came from Google Analytics (because of its native integration with Google Ads). There will always be discrepancies across analytics and media platforms. In the instance above, we ended up migrating Google Ads reporting to Adobe Analytics.
Web Analytics usually simply helps us understand the “What” Clickstream data typically does not tell us why something happened. Since many of us in the Web Analytics community don’t have optimal awareness of this methodology we’ll go into some detail about how lab usability tests are conducted.
Click maps show you a heat map comprised of aggregated click data. It’s also easy to take in aggregate click data quickly and see broad trends. However, you can also see where people click in Google Analytics, which is generally preferable. If you’ve set up enhanced link attribution , the Google Analytics overlay is great.
However, about 5% of the VCs in our database, mostly younger ones, are trying to build a competitive advantage by crawling large amounts of publicly available data and building analytical functions to flag companies with accelerating traction to them. ” Historically, investing was a manual, artisan process. Two Sigma Ventures.
Remember: Engagement is not a metric, its an excuse. ]. See if you were able to get more traffic to arrive at your site, and if they were Existing Visitors or New Visitors (hopefully measured with a first party cookie in your website analytics tool). The ideal metrics for this desired outcome are Visitor Loyalty & Visitor Recency.
At a high level, user experience is the aggregate and subjective experience of using a product such as a website or app. They’re also remarkably popular because, like digital analytics, it’s a form of passive data. You might improve user satisfaction metrics with a set of changes, but revenue per visitor goes down. Does it work?
App-specific metrics. Another thing that became increasingly useful was to have thousands of custom stats aggregated over thousands of servers graphed. Poor man’s analytics with bash. Better than switching off features! Very scalable, and this made it possible for us to track thousands of stats in near real time.
In fact I've gone so far as to say: "All data in aggregate is crap." " That's certainly a bit melodramatic, but beyond the most bare bones "ahh, I see something is happening" you are unable to get anywhere with aggregate data. Google Analytics: New Segmentation User Experience.
Know the difference between leading and lagging metrics. While it’s always necessary to keep track of lagging indicators to evaluate ongoing performance, as marketers we want to understand what causes those metrics to move either up or down. As you can see, leading metrics differ wildly depending on the brand and industry.
" comfort zone, and out of your Google Analytics, Site Catalyst, WebTrends worldview silo. Part of the reason is that the data you to which you have access narrows your worldview – "Hey, all I have is Google Analytics, so all I'll look at is Google Analytics data!" The answer is simple: Aggregators.
I am going to attempt to significantly simply your life by recommending the critical few metrics you should use to analyze performance of your digital marketing campaigns and website. Recommend metrics / KPIs you can use based on the size of your company. Best Metrics / KPIs for Small Business Websites. Obsess about this metric.
Investors sitting through Incubator or Accelerator demo days have three metrics to judge fledgling startups – 1) great looking product demos, 2) compelling PowerPoint slides, and 3) a world-class team. And we can offer investors metrics to play Moneyball – with the Investment Readiness Level. We think we can do better. Here’s how.
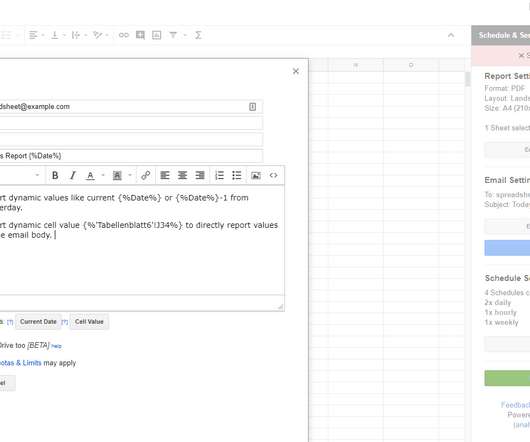
Four times per year, Bianca (our Customer Service Manager) downloads reports from each of these services and aggregates them into one supersize Excel spreadsheet, allowing us to perform fairly sophisticated analyses of the results. hourly distribution data allows us to schedule extra help for the busiest times of each day.
We organize all of the trending information in your field so you don't have to. Join 5,000+ users and stay up to date on the latest articles your peers are reading.
You know about us, now we want to get to know you!
Let's personalize your content
Let's get even more personalized
We recognize your account from another site in our network, please click 'Send Email' below to continue with verifying your account and setting a password.


Let's personalize your content